Seven areas monitored · Select a tile to explore its charts.
Why these colours? Read the evidence and limits
The analysis below explains the pressures in each area. A chart can appear in more than one area.
1. Monitoring an accelerating world
Explore the evidence, how its effects are distributed, and the new possibilities opened by AI.
1.1. Seven areas monitored
Set all chart windows
1.2. People & distribution: Growth for whom, concentrated where?
Average progress can hide different experiences. Distribution, ageing and the geography of growth belong beside the headline totals.
DISTRIBUTION
Who holds the wealth?
Compare the top tenth with the bottom half. Start with wealth, or switch to income for a different view of inequality. The world view and the distribution within a country answer different questions.
WID estimates, equal-split adults. Income is pre-tax national income after pensions; wealth is net personal wealth. Current downloaded histories end in 2023. They are not the separate 2025 snapshots in WIR 2026.
The richest tenth of adults held 74.4% of global personal wealth in 2023, barely changed from 74.6% in 2016. The bottom half held 2.0%.
2016 question How much wealth did the richest groups hold compared with the rest of the population?
What to watch If wealth grows while those shares hold steady, the gap in money terms widens.
URBAN CHANGE
More people. More density?
Not necessarily. A city can grow outward while its population grows. Compare population, people per square kilometre and concentration in a country's cities.
Six illustrative cities, not a representative global sample. UN WUP 2025 uses harmonised DEGURBA settlement extents, not administrative boundaries. Density is not a direct measure of crowding or service quality.
Dhaka gained 7.4 million residents from 2016 to 2025, yet its average density fell from about 5,970 to 5,370 people per km².
2016 outlook Rapid urban growth was expected to bring higher density and greater pressure on local services.
THE GEOGRAPHY OF DEMOGRAPHIC CHANGE
Different places, different futures.
In 2023, Africa had about 1.48 billion people and Europe about 747 million.
2016 outlook Regional projections highlighted the demographic weight of China and India.
Outlook The UN’s medium projection puts Africa at 2.47 billion in 2050 and Europe at 705 million. A rising world total can hide a regional decline.
UN World Population Prospects 2024, processed by Our World in Data. Estimates end in 2023; 2024 onward, including 2026, is a medium-variant projection. Dashed lines are projections, not observed outcomes. Source ↗
1.3. 2016 → 2026: ten years later, what held up, what changed
The 2016 book revisited in 2026: original expectations and concerns, the evidence that followed, and the arguments that need revising.
2016 → 2026 · A return to the evidence
Original expectation or concern
What the decade revealed
Looking back, ten years later
Original expectation or concern
Population
Eight billion by 2022; continued demographic hypergrowth.
What the decade revealed
About 687 million more people in 2016–2025. Eight billion reached in 2022, as forecast.
Looking back, ten years later
Eight billion arrived on schedule. The world grew larger, but population growth slowed; the idea of ever-faster growth needs revising.
Original expectation or concern
Global economy
Economic expansion, with rising consumption, inequality and waste.
What the decade revealed
Real global output grew by over a quarter in 2016–2025; output per person by roughly a sixth.
Looking back, ten years later
Continued expansion was correctly anticipated. Its uneven course makes the distinction clearer: producing more does not necessarily mean that everyone lives better.
Original expectation or concern
Technology
Rapid advances in computing, robotics and AI.
What the decade revealed
The cost of GPT-3.5-level AI performance fell more than 280-fold from November 2022 to October 2024.
Looking back, ten years later
Rapid technical advances were rightly anticipated. Turning those advances into widely shared benefits has proved a slower, less straightforward journey.
Original expectation or concern
Data
More data and knowledge, but saturation and privacy risks.
What the decade revealed
Internet use spread from fewer than half of humanity in 2016 to nearly three in four in 2025.
Looking back, ten years later
Wider connection became a reality. Greater understanding did not follow automatically; that still requires judgment and the willingness to question.
Original expectation or concern
Environment
Growing material use and waste could overwhelm ecological recovery.
What the decade revealed
Annual plastics production rose from about 371 million tonnes in 2018 to 431 million in 2024: about 60 million tonnes more.
Looking back, ten years later
The concern about accumulating damage remains well founded. Some extinction estimates and explanations were too sweeping and need correcting.
Original expectation or concern
Freedom and society
“Hyperdemocracy”, but also stagnation, surveillance and concentrated power.
What the decade revealed
Freedom House assessed 54 countries as less free in 2025, against 35 that improved.
Looking back, ten years later
The democratic optimism needs tempering. Warnings about surveillance and concentrated power have aged better: connection has not guaranteed a greater voice.
Original expectation or concern
Health
Medical advances, but chronic disease and unequal access.
What the decade revealed
Global life expectancy rose from 72.2 years in 2016 to 73.5 in 2024, despite the pandemic setback.
Looking back, ten years later
Medical progress brought real gains. Its promise still depends on access to care, treatment of chronic illness and resilience during crises.
A larger world is not always a faster-growing world.
The concern that human capabilities can outpace our ability to manage their consequences remains persuasive. What needs revision is the idea of one accelerating trajectory across all seven domains, or an inevitable loss of control as speed increases.
From Part I of the 2026 book: “Ten years later: what held up, what changed.” These are assessments of the original arguments, not a numerical prediction score. Each outcome retains its evidence dates; full-year 2026 outcomes and projections for 2050 remain untested.
AI connects the trends above: computation and data become tools that can help people analyse, create and act. The question is how to turn expanding capability into useful, widely shared progress.
MEASURING CAPABILITY
What has changed?
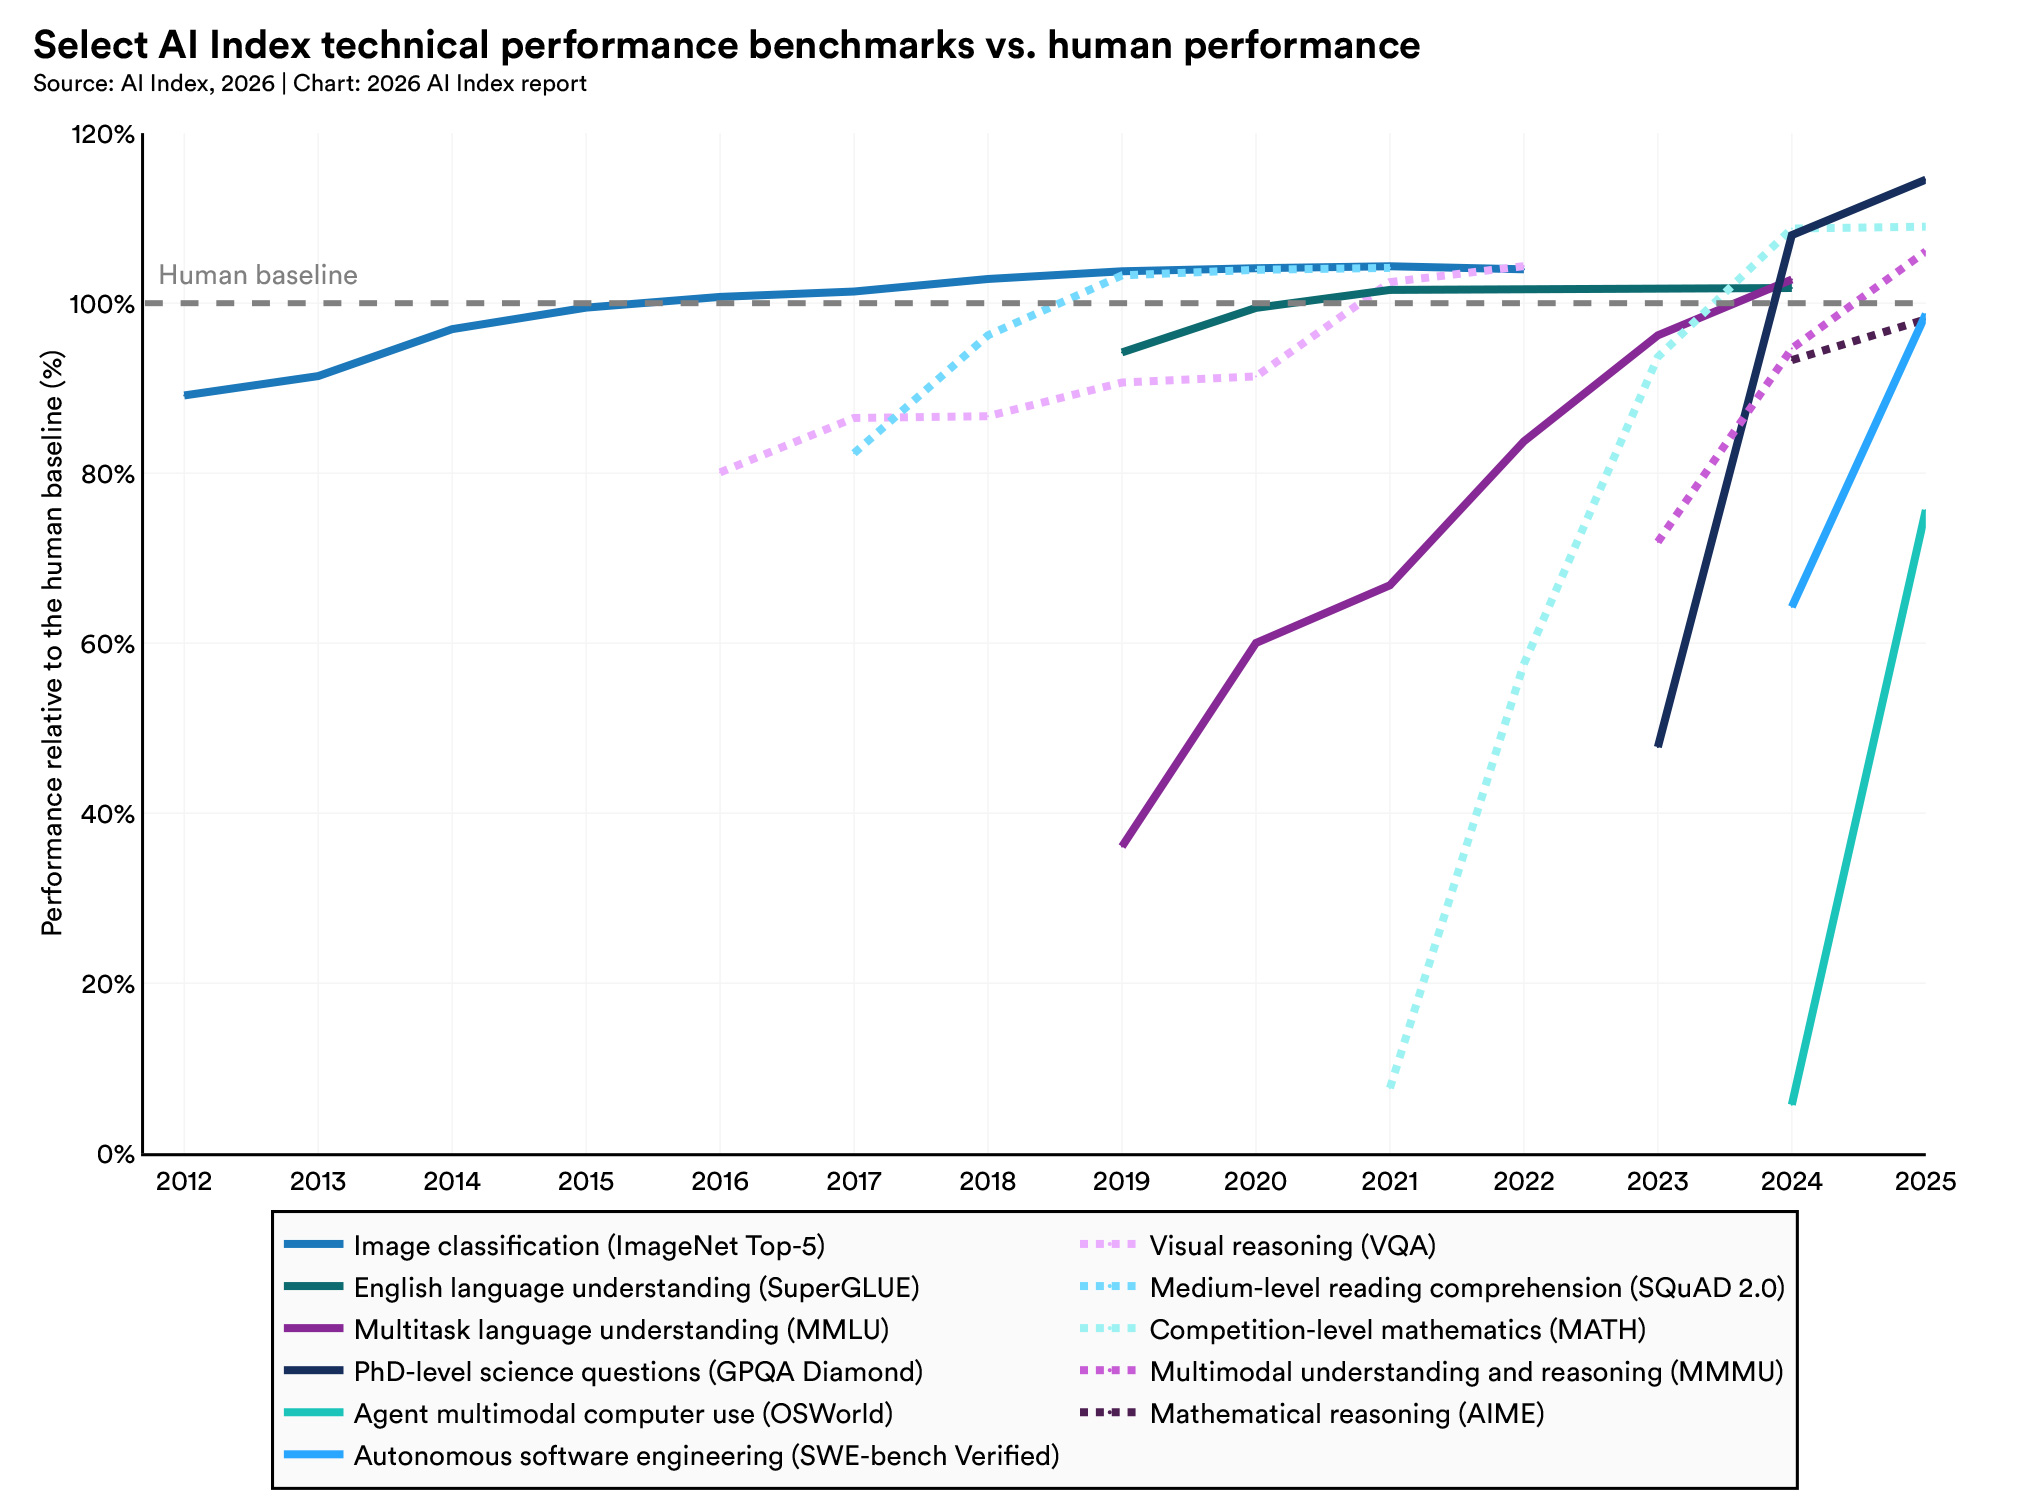
By 2025, leading AI systems had surpassed the human benchmark on selected science and maths tests but still fell short on tasks that require operating a computer.
2016 question How quickly would machines match or surpass human abilities, and on which tasks?
What to watch Can systems close the computer-use gap when tested under the same rules?
Stanford HAI, AI Index 2026, Figure 2.1.1 · data through 2025. Each line has its own human reference; 100% is not perfect accuracy. Different systems can supply the results across tasks and years. Tap the chart to enlarge.
A higher benchmark score opens possibilities. Dependable performance outside the test requires separate evidence.
Benchmarks can saturate, contain errors or reward familiarity with a test. Read this as evidence of changing task capability, not proof of general judgment or safe autonomy. Source and interpretation ↗
WHY NOW?
Three advances reinforce one another.
Better data
Useful examples, careful selection and checked demonstrations shape what a model can learn. Quality and coverage matter alongside volume.
Better learning methods
Architectures, training objectives and feedback change how a model uses its examples. Pre-training builds broad patterns; post-training shapes behaviour and task performance.
Better computation
Accelerators, memory and parallel processing make larger training runs and more experiments feasible. Efficient software helps turn hardware into useful work.
Better examples improve learning; better methods use resources more effectively; more usable computation expands what can be tried.
Conceptual explanation, not a measured allocation of progress between three causes.
From microprocessors to AI chips
The transistor curve spans more than half a century. Moore’s roughly two-year doubling became an industry reference, not a law guaranteeing performance. Modern GPUs add parallel computation and advanced packaging; some combine multiple compute dies. Transistor totals therefore do not measure speed, efficiency or useful work on their own.
Memory, data movement, numerical precision and software also matter. The same hardware can deliver different results depending on how it is used.
Stanford’s 2025 AI Index reports that the price of querying a model at a fixed GPT-3.5-level benchmark threshold fell from $20 to $0.07 per million tokens between November 2022 and October 2024—more than a 280-fold reduction. This compares a particular performance threshold, not every model or the full cost of deploying AI.
Lower prices can widen access. Useful adoption still depends on skills, reliable infrastructure, suitable workflows and who controls the tools.
Illustrative opportunities and pressures to examine, not measured net effects.
Area
Potential contribution
Question of control
Population
Care assistance and planning for changing needs
Does support preserve autonomy and reach underserved communities?
Economy
Productivity and new services
Who gains, who is displaced, and how concentrated are the returns?
Technology
Faster design, coding and experimentation
Can testing and oversight keep pace with deployment?
Data
Better analysis and cyber defence
How do we limit surveillance, misuse and automated attacks?
Environment
Resource optimisation and environmental monitoring
Do verified savings exceed added energy and material demands?
Health
Research and clinical assistance
Are benefits validated, affordable and reliable across populations?
Freedom & society
Access to knowledge and participation
Can people challenge decisions and retain independent judgment?
Faster capability is not the objective by itself.
AI could increase the pace of change and improve our ability to respond. Which effect dominates depends on deployment, institutions and the distribution of power. The aim is a sustainable pace of useful progress, with the capacity to detect harm, correct mistakes and share the gains.
Understand the shapes of growth, then explore how the capacity to respond can keep pace.
2.1. Understanding growth shapes
The shape of a curve changes the demands a system must absorb. Compounding, connectedness and cycles help explain those demands; our ability to observe, act and correct determines how well we respond.
SCHEMATIC CURVES · NOT FORECASTS
Three curves, three different stories.
A rising level is not enough to establish an increasing percentage growth rate. Read the shape, the time horizon and what is growing.
Linear
Add 0.18 at each step and the index rises from 1 to 19 in 100 steps.
Next ten steps Ten more steps add exactly 1.8. The same addition becomes a smaller percentage as the total grows.
Exponential
At 3% per step, the index grows from 1 to 19.2 in 100 steps.
If the rate holds Ten more steps add about 34% to the new, larger base. The percentage stays constant while each addition grows.
Saturation / S-curve
Here growth is fastest near 10, halfway to the ceiling of 20. The total keeps rising as each new increase shrinks.
2016 example Bacteria growing in a finite environment illustrated how limited resources can slow growth.
Illustrative shapes on a shared linear index scale, starting at 1. Time is schematic; these are not fitted histories.
Factors shaping growth
01 / COMPOUNDING
Growth builds on growth.
Each increase expands the base for the next. Several drivers can also reinforce one another. A small sustained rate can create a large change in scale.
02 / CONNECTEDNESS
Consequences cross domains.
A change in one area can alter demands in another: more data can require more energy and stronger security. Interactions may amplify or dampen pressure.
03 / CYCLICITY
Trajectories can turn.
Feedback, constraints and recurring cycles can interrupt expansion or bring reversal. Neither endless growth nor inevitable collapse follows from a rising curve alone.
ARITHMETIC ILLUSTRATION
What a century does to a small percentage.
Every line starts at 1. The annual percentage stays constant; the amount added each year grows.
All four rates
After a century, 1% annual growth turns the starting amount into 2.7 times as much. At 5%, it becomes 131.5 times as much.
Assumption Each rate holds for all 100 years. Interruptions would change the endpoint.
Lower rates, closer view
After a century, the starting amount grows 7.2-fold at 2% a year and 19.2-fold at 3%.
Reading the gap One extra percentage point each year more than doubles the final amount.
Linear axes in both panels, with different vertical ranges. Level = (1 + annual rate)years. Constant rates, no shocks or saturation: mathematical scenarios, not forecasts. Multipliers show the level reached, not the sum of annual flows.
What grows matters.
If the rising quantity is an annual physical burden, each year can demand more collection, treatment or infrastructure. Unresolved flows can accumulate into a stock even when their growth slows. Capacity, prevention and ecological limits determine the consequences.
FROM SCALE TO RESPONSE
Can the capacity to respond keep pace?
Absorption means the practical ability to handle change: understand it, act on it and correct its consequences. A one-time improvement can create breathing room, but sustained growth may use it up. The following scenario compares pressure and response on one assumed scale; it does not claim a measured global absorption limit.
ILLUSTRATIVE SCENARIO · CYBERSECURITY
A one-time capacity gain buys time. It does not stop workload growth.
In this scenario, a one-off 3.1-fold boost to capacity buys about 6.2 years before a workload growing 20% a year catches up.
What changes it If capacity also improves every year, the crossover moves later. If it grows as fast as the workload, the gap never closes.
Common workload index: manual capacity = 100. All future lines are assumptions, not observed global cyber threats or a forecast of attacks.
What comes from evidence, and what is assumed?
This example uses a Microsoft October 2025 randomised study of 167 professional analysts. Its workflow calculations imply roughly 3.1–6.5× correctly identified malicious emails per analyst-minute under particular prevalence, precision and recall assumptions. The lower 3.1× case assumes 20% malicious mail and 80% precision and recall, with automated benign-mail handling.
The 20% annual workload increase is illustrative. Staffing, task mix and effectiveness are held constant; implementation overhead, errors and automation bias are not modelled. A task-specific vendor study does not establish a 3.1× reduction in breaches or a universal productivity gain.
Measure detection delay, error rates and the human ability to check an answer. Faster output alone does not establish better judgment.
02
Decide & respond
Measure the time from a warning to action, trained staff and available infrastructure. Capacity is specific to the task.
03
Correct & recover
Measure appeal times, fallback readiness and successful recovery. A response system needs a practical way to change course.
Control can enable useful speed. Explore how prevention, greater response capacity and shorter delays change the gap in Speed and control simulator ↓.
2.2. Play with Growth: test your intuition
Stop in time, revisit 2016, manage a shrimp lagoon, make an idea spread, and explore the efficiency surprise. Six short games, including the classic rice chessboard, with sources and assumptions.
Explore the conceptual relationship between pressure, adaptive capacity and exposure. These controls express assumptions; they do not measure the world's current state.
Acceleration potential A
Adaptive capacity C
Relative pressure Ω
In the default scenario, pressure reaches 4.9 times response capacity in year 20.
Model assumptions Pressure grows 8% a year. Capacity starts growing two years later, at 3%. An earlier response reduces the gap even with the same rates.
A = ∛(P × I × N) C = ∛(G × R × L) Ω = (A ÷ C) × E
Dimensionless conceptual ratios, not calibrated indicators, probabilities or safety thresholds. The time paths are an illustrative extension: pressure = 100 × A × E × (1 + p)t; capacity = 100 × C × (1 + c)max(0, t − delay). Equal values only mean equality on this assumed common scale. No empirical global “absorption capacity” is claimed.
SOURCE ESTIMATES
The recovery gap.
Electronic waste generation and documented formal collection and recycling, in million tonnes per year.
48.2 Mt / year
Generation minus documented formal recovery, 2022 Up from 26 Mt in 2010
Formal recovery is a measurable response, not total societal absorption. The remainder includes informal recycling, storage and other destinations; it is not all landfill or proven harm.
Documented e-waste recovery rose from 8 million tonnes in 2010 to 13.8 million in 2022, yet the annual recovery gap widened from 26 million to 48.2 million tonnes.
Looking ahead To narrow the gap, formal recovery has to add more tonnes each year than waste generation adds.
3. Futures & governance
Explore possible directions, then the institutions and safeguards that could help shape them.
3.1. Projecting some potential futures
Five selected from the ten scenarios in the book. Three are illustrated below, with two variants of Mother AI showing who has final authority. These are possibilities to examine, not forecasts or a ranking of likelihood.
AI helps people understand, compare and act; human institutions retain consequential decisions. Benefits depend on people having the expertise, time and power to question recommendations and change course.
AI compares options
↓
People decide within a public mandate
↓
Bounded action + observed effects
↺Evidence + appeals return to human review
People can review, correct or stop the action.
BOOK SCENARIO 1 / VARIANTS A AND B
Mother AI: two variants
The same coordinating intelligence could operate under two different allocations of authority. The human-led variant overlaps with human–AI partnership; both are hypothetical possibilities.
A · AI has final authority
People voluntarily entrust Mother AI with final authority. Specialist systems carry out its decisions. Independent evidence and freedom to question preserve critical judgment, but humans have no binding veto.
People choose to delegate
↓
Mother AI decides
↓
Specialist systems act
↺Independent evidence + freedom to question
People can question a decision; Mother AI retains the final say.
B · Humans have final say
Mother AI proposes actions within a public mandate. Human institutions retain the final say over consequential decisions and can revise or withdraw the mandate. Routine actions may proceed within explicitly delegated limits.
Mother AI compares options and proposes action
↓
Human institutions retain final authority
↓Required authorization grantedAct within the mandate
↓Authorization withheld or protective holdPause and review
↺Revise the proposal and return to human review
Every affected person can request review. The mandate defines who may withhold authorization or impose a protective pause, on what grounds and by when. An objection does not automatically stop every service.
BOOK SCENARIO 5
Rival AI powers and a fragmented world
States, companies or autonomous systems pursue competing goals. Diversity can preserve choice, but incompatible systems, conflict or collusion can turn individual gains into collective harm.
Rival states and companies
↓
Separate AI systems and goals
↓
Effects cross borders
↺Crisis communication + common safeguards?
Shared protocols can connect rivals; without them, local gains may create shared losses.
Humanity under control
An authority uses AI to impose control, or dependence becomes impossible to challenge. Material comfort may remain while meaningful consent and freedom disappear.
Deliberate limits
Societies adopt useful AI while deliberately limiting its authority, surveillance and reach. Restraint may protect freedom and human skills, but can also delay benefits or protect existing privilege.
Scenario 1 now distinguishes Mother AI with final authority (A) from Mother AI under retained human authority (B). Variant B overlaps with scenario 2, human–AI partnership. The ten scenarios remain a set of possibilities, not an exhaustive or exclusive classification.
Source: Part III, Chapter 1, “Humanity and AI: Possible Futures, Shared Choices”, scenarios 1, 2, 4, 5 and 7. The book also explores augmented humanity, machines after humanity, uneven or interrupted progress, intelligence from beyond Earth and divine intervention. Scenarios can overlap; the final two are explicitly thought experiments.
3.2. Governance options for speed and control
These models explore how authority is distributed between human institutions and whether humans retain the final say over AI. They can overlap. The diagrams illustrate arrangements for discussion, not established evidence that any model would work.
Control with checks, participation and correction.
The manuscript distinguishes chosen AI authority from human-led governance. Its governance chapter sets out mandates, independent review, appeals, emergency intervention and recovery. The diagrams below make decision and checking routes visible; they do not establish that any design would work automatically.
GOVERNANCE MODEL 1
National institutions and market-led AI
A country-level model: public institutions set rules while companies develop and operate AI. It resembles parts of today’s arrangements, without implying that every country has the same political or economic system. Cross-border effects still require cooperation.
Citizens + national institutions
↓
Public rules + company decisions
↓
AI services affect people and ecosystems
↺Complaints → independent regulators and courts → correction
Courts and regulators review within their jurisdiction. International agreements connect national systems.
Strength and vulnerability
Competition can encourage invention and preserve choice. Capture, unequal access and regulatory gaps can weaken control. Clear duties, independent scrutiny and cross-border coordination are the checks to examine.
GOVERNANCE MODEL 2
Global parliament within a system of shared powers
A possible global parliament could establish common protections for specified cross-border problems. National, local and sector institutions would retain decision-making powers within those protections. Independent review would enforce the limits of each institution’s authority. Representation, enforcement, citizen appeals and any expansion of the global mandate would require explicit agreement.
People represented through agreed democratic procedures
↓
Global parliament: defined cross-border powers
↓
National, local and sector institutions: retained decision powers
↺Independent review: decisions, remedies and limits of authority
Shared protections, coordination and resolution of disputes connect these institutions. Citizens need accessible routes to challenge both implementation and the rules themselves.
Strength and vulnerability
Shared rules could address problems beyond one country’s reach. Unequal representation, weak enforcement and concentrated power are risks. Limited mandates, public reasons and independent powers of review would be central.
GOVERNANCE MODEL 3 / VARIANTS A AND B
Mother AI: two variants
The same coordinating intelligence could operate under two different allocations of authority. The human-led variant overlaps with human–AI partnership; both are hypothetical possibilities.
A · AI has final authority
People voluntarily entrust Mother AI with final authority. Specialist systems carry out its decisions. Independent evidence and freedom to question preserve critical judgment, but humans have no binding veto.
People choose to delegate
↓
Mother AI decides
↓
Specialist systems act
↺Independent evidence + freedom to question
People can question a decision; Mother AI retains the final say.
B · Humans have final say
Mother AI proposes actions within a public mandate. Human institutions retain the final say over consequential decisions and can revise or withdraw the mandate. Routine actions may proceed within explicitly delegated limits.
Mother AI compares options and proposes action
↓
Human institutions retain final authority
↓Required authorization grantedAct within the mandate
↓Authorization withheld or protective holdPause and review
↺Revise the proposal and return to human review
Every affected person can request review. The mandate defines who may withhold authorization or impose a protective pause, on what grounds and by when. An objection does not automatically stop every service.
Strength and vulnerability
Both variants concentrate coordination in a common intelligence. In A, correction ultimately depends on Mother AI responding. In B, human control requires independent expertise, usable appeals and practical alternatives; a ceremonial signature would not be enough. Neither arrangement guarantees good outcomes.
Based on Part III: Chapter 1’s hypothetical futures, including both Mother AI variants; Chapter 2’s proposed responsibilities, appeals and emergency procedures; and Chapter 3’s discussion of distributed authority and a possible limited global parliament. The national/market and global-parliament diagrams are website elaborations. These diagrams are conceptual proposals, not tested governance systems.
A correction process for human-led governance.
Where humans retain authority, decisions need a visible route from evidence to action and from a challenge to a remedy. The powers below apply to human-led arrangements, including Mother AI variant B; variant A preserves scrutiny without a binding human veto.
Observe & disclosePublish indicators, incidents, uncertainties and who is responsible. Protect privacy and legitimate confidential information.
Deliberate & decideHear affected groups, compare alternatives and record reasons, limits and review dates.
Act & evaluateUse bounded implementation, monitor outcomes and check whether benefits and burdens are fairly distributed.
Challenge & appealGive affected people an accessible way to request an explanation, independent review and correction or reversal.
Pause, repair & reviewDefine emergency triggers and who may pause a system. Provide safe fallback, time-limited powers, independent review and conditions for restart.
Appeals need published response deadlines and protection against retaliation. Emergency intervention must be proportionate: stopping a critical service can itself cause harm. Review findings should feed back into the next decision.
Measure whether control works.
Track time from warning to action, access to appeals, correction and recovery times, recurrence of failures, distribution of impacts and concentration of decision power. Assess these together: a fast decision is not necessarily a good one, and a low appeal count may reflect barriers to challenge.
The forum opens on Discourse. Read freely; sign in or create a forum account to reply. Contributions are public.
Share
What happens when growth outpaces our ability to respond? Explore the evidence, try six growth games, and consider futures for AI and human governance.
Contact
From 2016 to 2025, the world added 687 million people even as annual growth slowed from 1.16% to 0.91%.
2016 projection Eight billion people by 2022 and nine billion by 2032.
Outlook The world reached eight billion in 2022. The UN projects nine billion around 2037, five years later than the earlier projection.
Reading the curve A smaller percentage of a larger population can still add tens of millions in a year.
Between 2016 and 2025, the share of people aged 65 or older rose from 8.4% to 10.4%, while the share under 15 fell from 26.5% to 24.4%.
2016 outlook Population ageing and chronic illness were expected to increase the need for primary care.
Looking ahead As today’s middle-aged adults turn 65, communities may need more care places even where school enrolment levels off.
In 2025, 33 cities had at least ten million residents, yet five in six city dwellers lived in smaller cities.
2016 projection More than 100 cities were expected to have at least ten million residents by 2050.
Outlook The UN projects 37 megacities by 2050 under harmonised city boundaries. The two projections use different boundaries.
World income per person rose 18% in real terms from 2016 to 2025.
2016 question How could economic growth coexist with widening inequality?
Behind the average In 2025, average income per person was about €49,100 in North America, €29,100 in Oceania and €3,100 in sub-Saharan Africa.
Global coverage of essential health services edged from 69 to 71 out of 100 between 2016 and 2023.
2016 question Would advances in medicine chiefly benefit those already able to afford care?
What to watch In 2023, low-income countries scored 47 and high-income countries 85. A narrowing gap would show whether coverage is converging.
NVIDIA’s Rubin package contains 336 billion transistors across two compute dies, nearly 22 times the P100’s 15.3 billion in 2016.
2016 assessment Microprocessor capabilities appeared to be advancing faster than Moore’s law would suggest.
Reading the curve Combining two dies lifts the package total. A timed test of the same task would show how much faster the hardware runs.
In June 2026 the fastest supercomputer on TOP500’s test reached 2.20 exaflops, almost 24 times the 2016 result.
2016 outlook Rapid advances in computing were expected to enable progress in robotics and AI.
What to compare The next ranking will measure progress on the same linear-equation test. A machine can rank differently on another workload.
IDC estimates that 64 zettabytes of data were created or copied in 2020.
2016 outlook Digital data was expected to multiply. How much of it would become useful knowledge?
Outlook IDC forecasts more than 718 zettabytes a year by 2030. Making another copy adds to that total.
Internet use rose from 43.6% of people in 2016 to 73.6% in 2025. Mobile subscriptions reached 111.5 per 100 people.
Reading the gap One person can hold several subscriptions. The share of people online shows how much further access can spread.
NCC tracked 7,874 ransomware cases in 2025, almost triple its 2021 count. Malware detections on a separate network rose and then fell.
2016 outlook Wider connectivity was expected to create more opportunities for data theft and cybercrime.
Reading the curves The two networks count different events. Fewer malware detections can coincide with more reported ransomware cases.
SpyCloud collected at least 65.7 billion exposed identity records in 2025, up from 43.7 billion in 2023.
Reading the total One person can appear many times. Wider collection alone can raise the next count.
V-Dem’s population-weighted liberal democracy index fell from 0.342 in 2016 to 0.273 in 2025 on a scale of zero to one.
2016 outlook “Hyperdemocracy” was one possible future. Political disengagement and concentrated power were competing risks.
Atmospheric CO₂ rose from 403 to 426 parts per million between 2016 and 2025. Global temperature ended 2025 at 1.18°C above the 1951–1980 average.
Reading the curves A cooler year can interrupt the temperature line even as CO₂ accumulates. Warming is easier to see across decades.
Wind and solar supplied over four times as much primary energy in 2025 as in 2016. Oil, coal and gas still supplied 86% of the 2025 total.
2016 question Could renewable energy loosen the economy’s dependence on fossil fuels?
What to watch Demand grew enough for fossil fuel use to rise too. Track the amount of fossil energy consumed alongside its share of the total.
An estimated 30 million tonnes of plastic had accumulated in the ocean by 2019.
2016 question What would rising plastic use and low recovery rates mean for the oceans?
Outlook The OECD’s baseline puts the total near 43 million tonnes in 2026. Plastic already in the ocean persists as new waste arrives.
Annual electronic waste rose from 49 million tonnes in 2016 to 62 million in 2022.
If the trend holds Extending the 2017–2022 increase gives about 71 million tonnes in 2026. A new inventory can test that estimate.
The EU grassland butterfly index fell about 20% from 2016 to 2024. Global hard-coral cover ended near its 2016 level after substantial swings.
Reading the curves Each line follows a particular habitat or group. Combining them into a single extinction forecast would lose that distinction.
From 2016 to 2023, global life expectancy rose by 0.6 years and healthy life expectancy by 0.3.
What to watch The gap widened by about 0.3 years. It measures time lost to ill health across a lifetime, which can occur at any age.
Sequencing a human-sized genome cost about $95 million in 2001 and $525 in May 2022.
Reading the cost A patient still needs someone to interpret the result. That work sits outside the sequencing price.
The estimated cost of sequencing a human-sized genome fell from $1,176 in May 2016 to $525 in May 2022.
2016 outlook Within a decade, everyone might have a digital copy of their own genome.
What to watch The next measure is how many patients receive sequencing and how often it changes their care.

 At a glanceExplore the dashboard: seven areas monitored
 Discover the book2016 → 2026: what held, what changed
 Acceleration gamesTest your intuition with 6 growth games
 Play 10 min Speed/Control SimulationOne More Minute, 2026 → 2036. Build machines, craft your world.
 Project future scenariosSimulate Speed & Control curves
 Give your viewFuture scenarios and governance